Data Preview
When tuning detection algorithms, it is useful to preview their effect on actual data. Open the preview by clicking Data Preview in the side menu. The preview window is split into a side panel for view settings and a main area showing results.
Start by selecting a Data View in the side-panel combobox and clicking Load Categories.

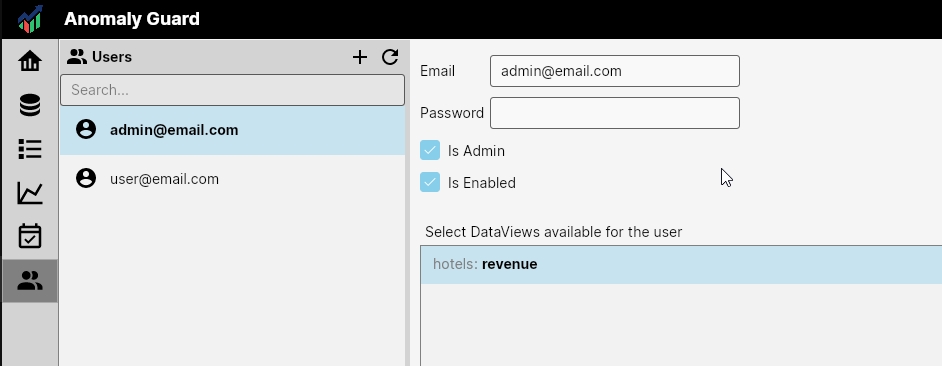
Data Views availability
If you do not see any Data Views here, even though they are deployed and enabled, add them to your account in User Management.
After loading a Data View, the side panel shows checkboxes for each category. Use these to define the combination of categories you want to preview.
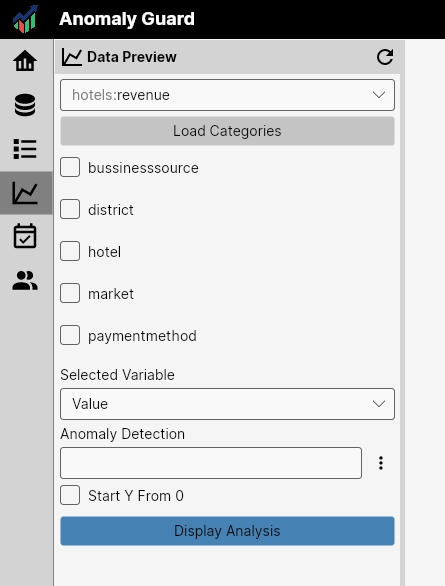
If all category checkboxes are set to FALSE, the preview displays raw daily values.

Use the Selected Variable combobox to choose which variable to inspect: Count, Value, or Avg. The example below demonstrates switching the variable from Value to Count.

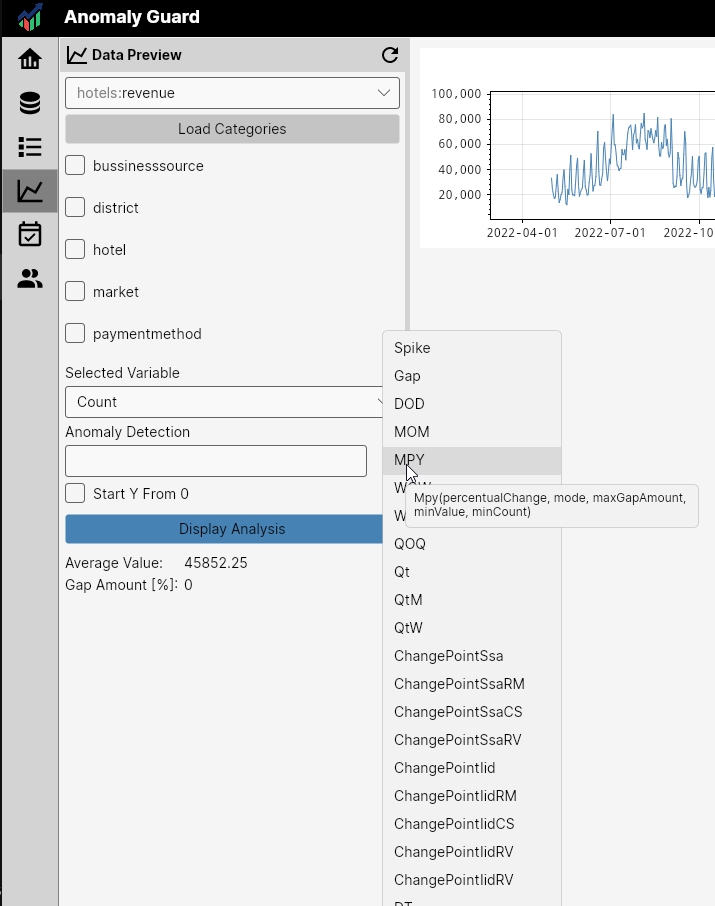
The Anomaly Detection textbox lets you define a detection algorithm for the preview. Click the button to the right of the textbox to open the algorithms menu. Selecting an algorithm inserts it into the textbox with default parameters.
If the textbox is empty, only raw data are displayed. If a detector is defined, the preview shows aggregated detection results.
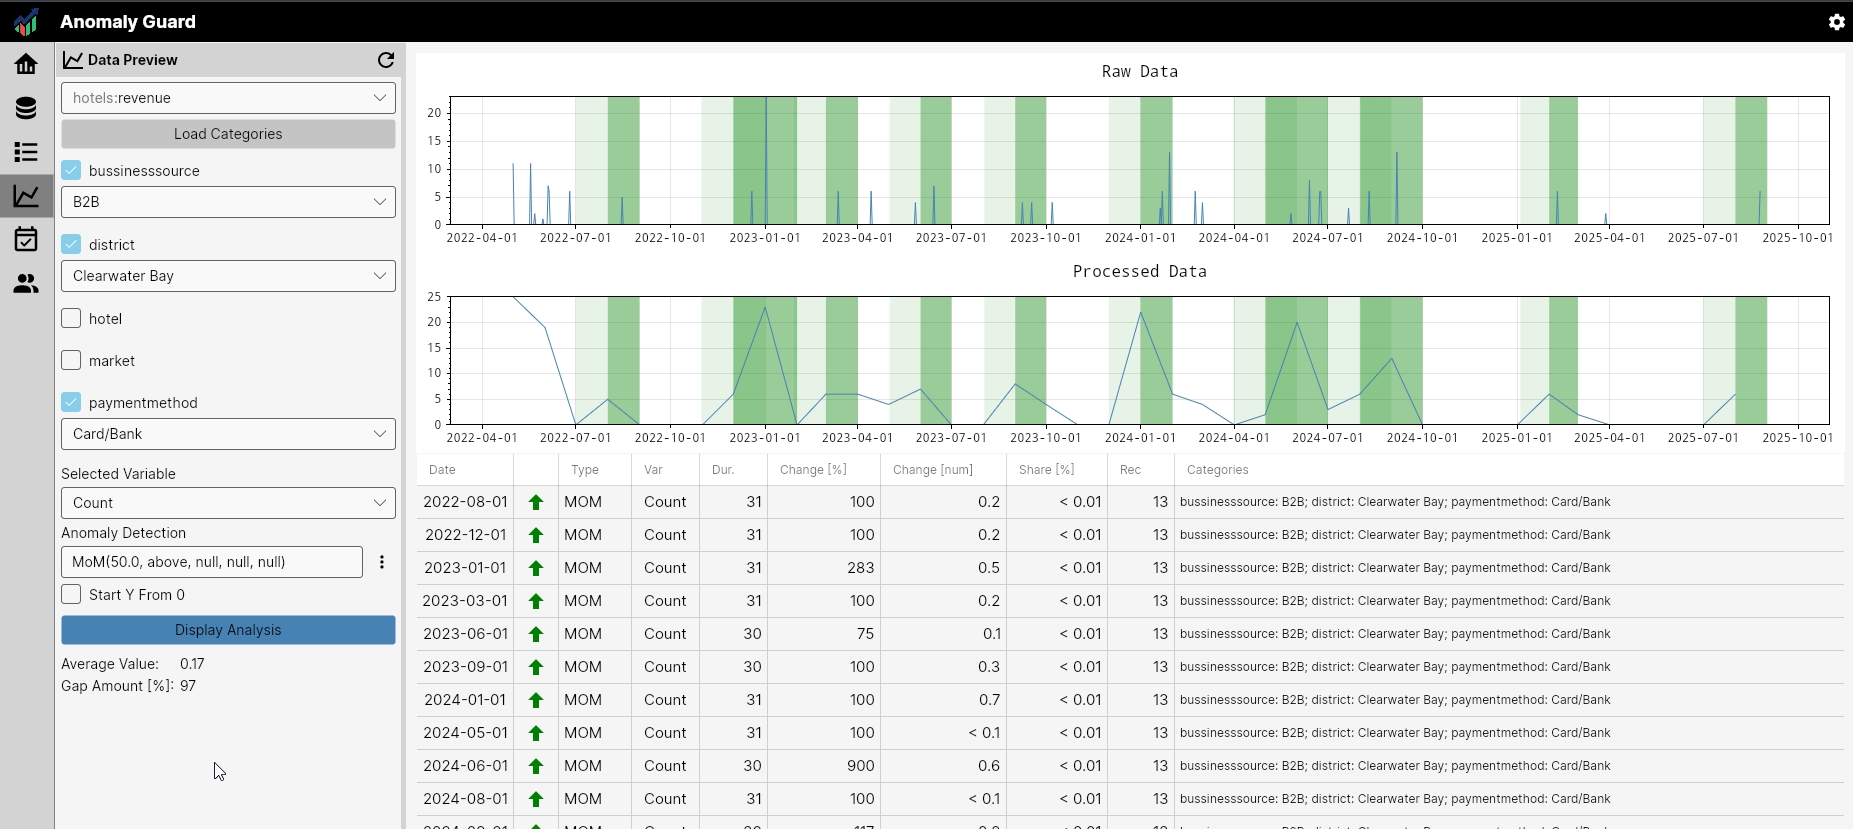
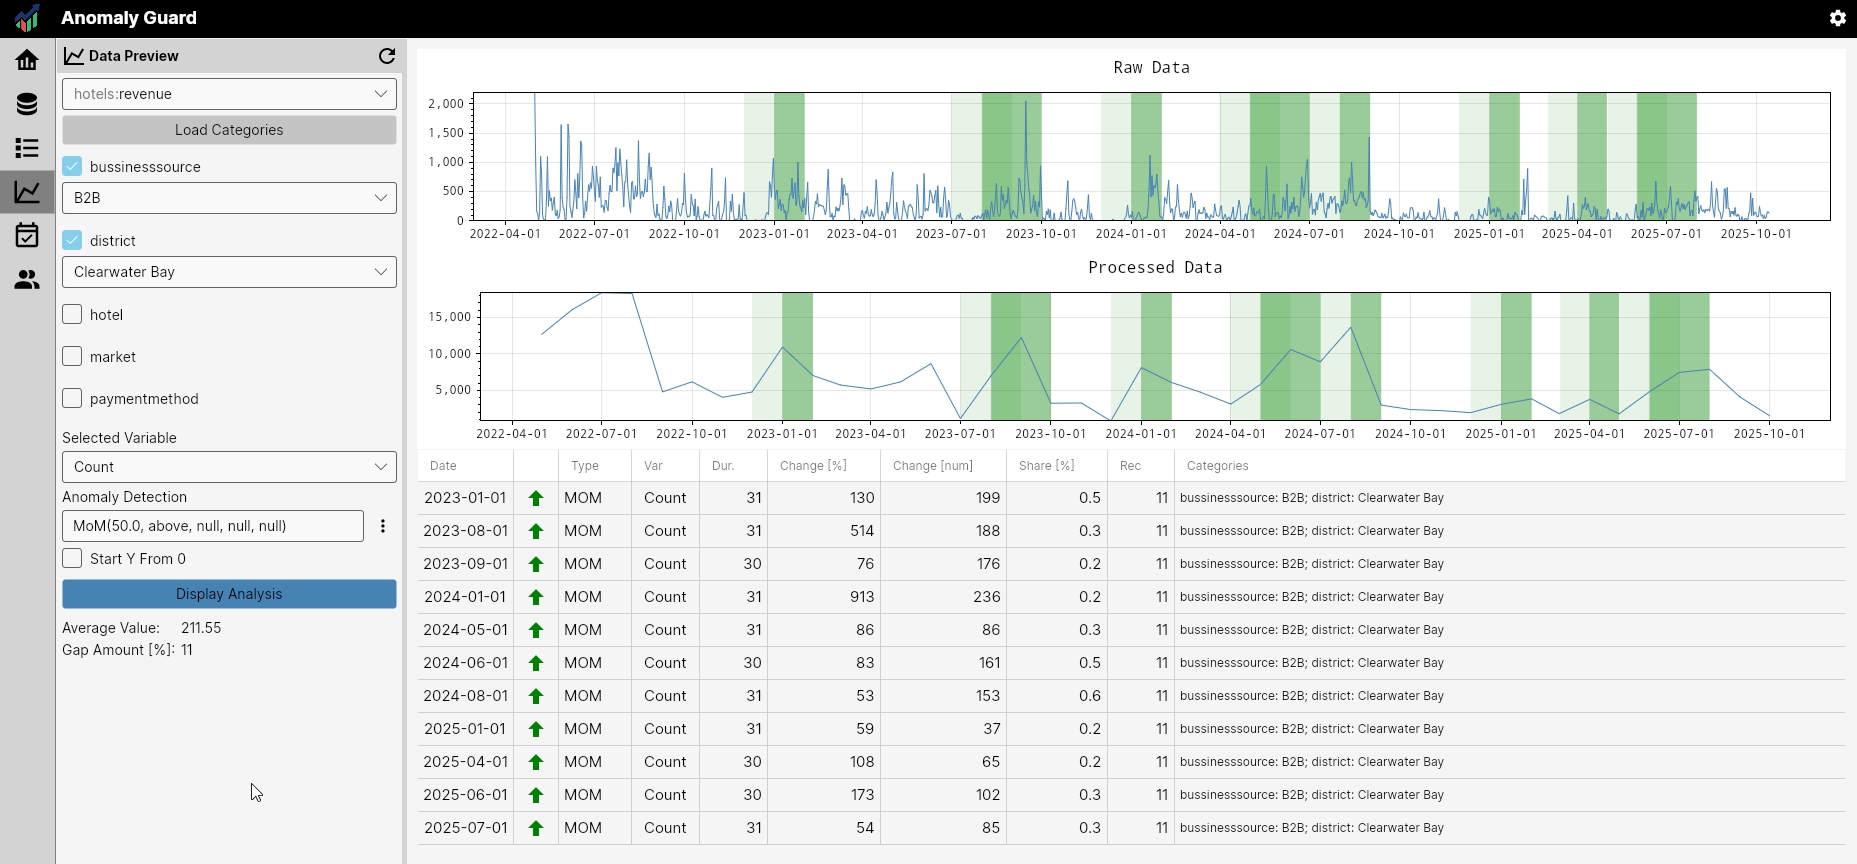
The next example applies a Month-Over-Month detector to the Count variable. The detector flags months with month-over-month growth greater than 50%.
In the first chart you can see daily values highlighting the anomalous periods. Since analysis is performed on aggregated monthly values, the second chart shows monthly aggregates. A table below the charts lists individual anomalies with quantification details.

Under the Display Analysis button in the side panel you will also find computed metrics for the selected category combination:
- Average value — average daily value over the available time series
- Gap Amount — percentage of missing data across the available time period
These metrics are useful when configuring detector parameters such as maxGapAmount, minValue, or minCount. See Analysis Setup for guidance on using these values.
The screenshots below show results for alternative category combinations.
Once you know how to define a Data View and use Data Preview, proceed to the next chapter — Analysis Setup — which describes the recommended methodology for defining analyses so they are meaningful, computationally feasible, and produce actionable insights for different business roles.