AnomalyGuard Dashboard
As mentioned in the previous chapter, users create filters over the cloud of detected anomalies. These filters should present a unique view of changes and anomalies in company data that are relevant to the user and their role, sorted by priority.
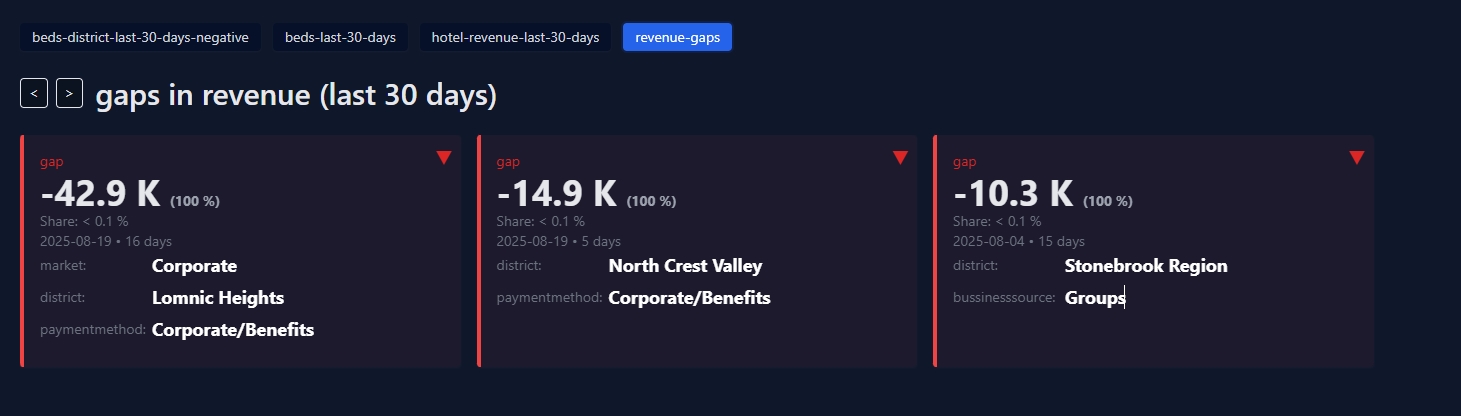
In the attached image, we see a list of 4 filters that the user prepared in the main AnomalyGuard application. These are filters over datasets representing bed occupancy and total revenue in a hotel chain across selected regions.

For regular analysis of results, the main application is usable but not ideal. Therefore, the AnomalyGuard installation includes a second application, AnomalyGuard Dashboard, whose purpose is to provide the obtained information in a simple, fast, and readable format.
We launch the application by entering the URL http://<your-host>/view or https://<your-host>/view in the browser. After entering it, the application login screen is displayed. The login credentials are the same as for the main application.

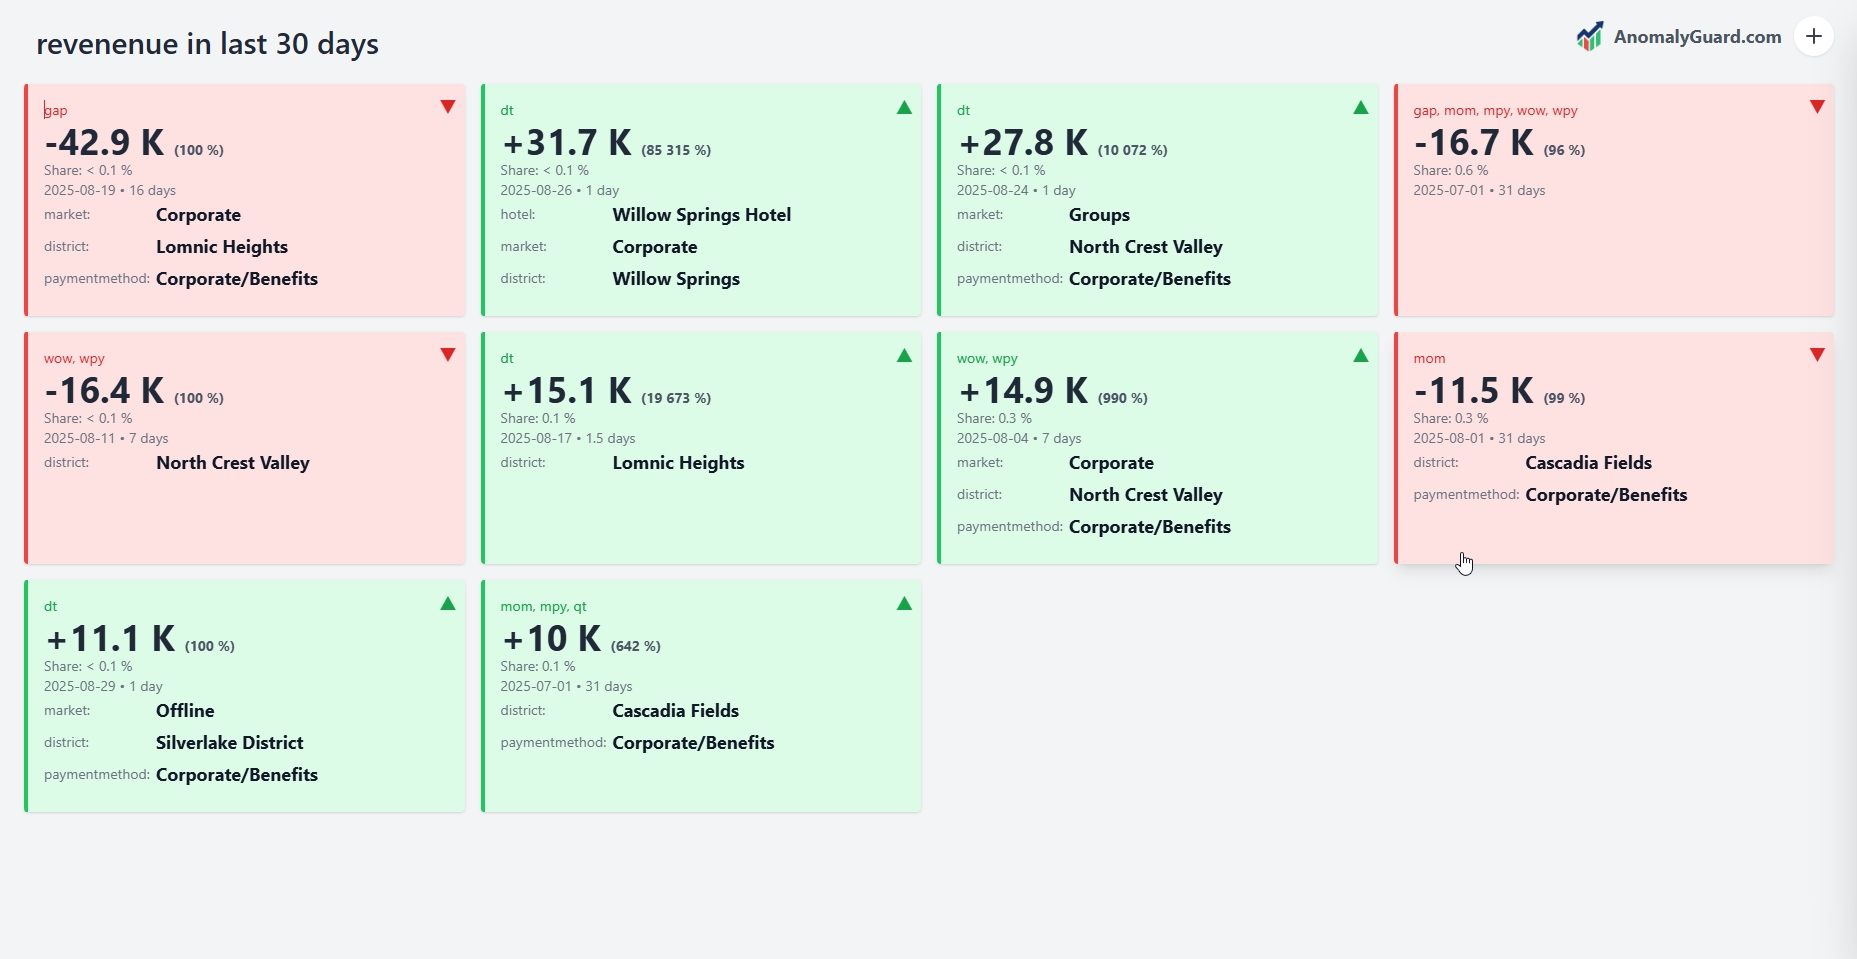
After successful login, the main Dashboard window is displayed, showing the results. This visualization displays results from filters prepared in the main application in a more readable form.
The application is very simple and consists of three parts. The main part of the window displays the results. The header shows information about the filters, and finally, under the plus button in the upper right corner, we find several settings with which we can customize the Dashboard.
First, let's introduce the menu hidden under the plus button in the upper right corner. When we click on it, a menu similar to the one in the following image is displayed. Using the first item - Log off - the user logs out of the application.
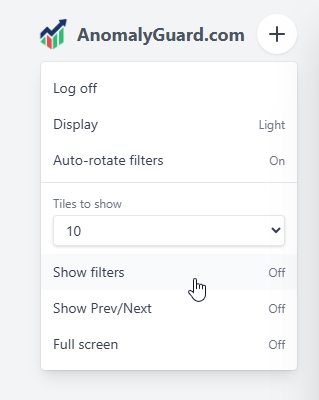
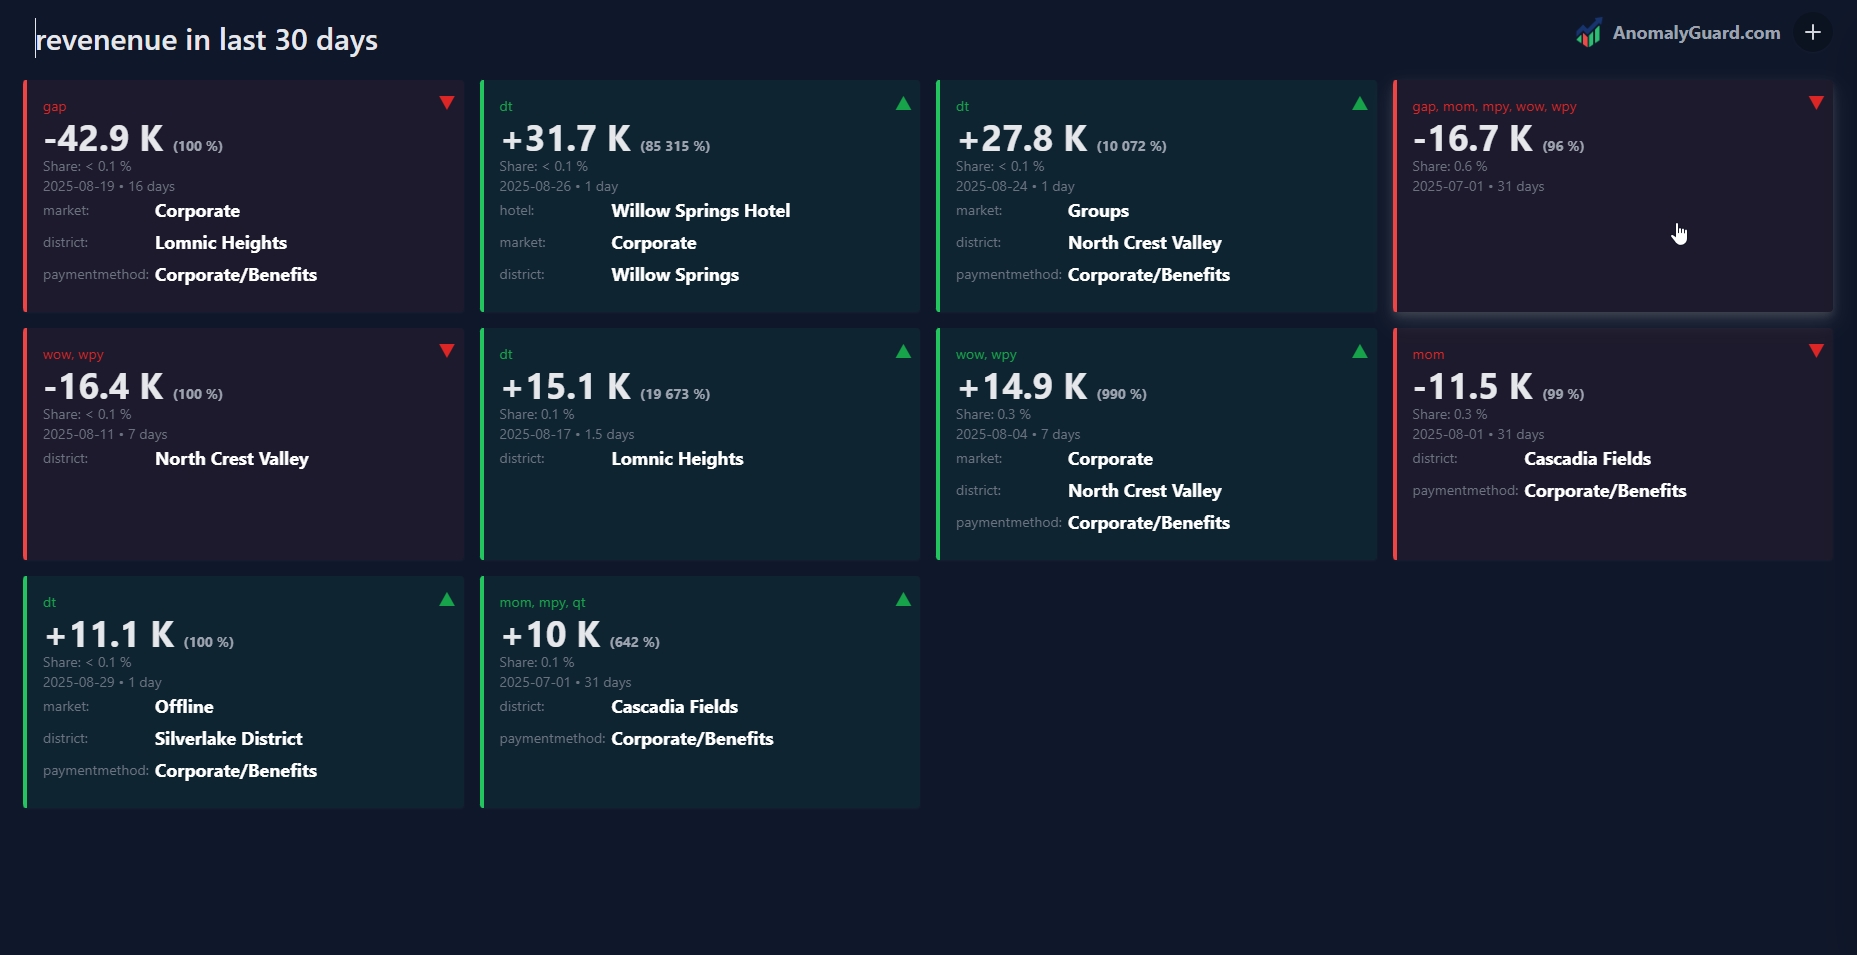
Using the second function Display, we can switch between Light mode and Dark mode according to user preference.
One use case for this application is displaying it on large screens within the company. However, if we have multiple filters, manually switching between them is not an ideal solution. For this purpose, we can use the Auto-rotate filters function. This function ensures that results from individual filters will progressively rotate, and no one has to manually switch them. We can use this function on large screens together with the last function Full screen, which ensures that the application is displayed across the entire screen.
Using the Tiles to show combobox, we can set how many top N tiles will be displayed on the screen. In the header section, for each filter, information from the comment parameter is displayed, which we set in the main AnomalyGuard application. In addition, we can customize the display of Previous - Next buttons (Show Prev/Next) and the display of filter names (Show filters) in the header. An example of a modified (full) header display in the Dashboard is shown in the following image.
The displayed tiles contain information about changes and anomalies in the form of easily readable insights. If anomalies in the filter are not aggregated, they display individual anomalies. If we let them be aggregated, they display these aggregates. If we click on a selected tile, a dialog with detailed information is displayed - information about the aggregate and a list of assigned anomalies in a table.

If we click the view button in a table row, the selected event in the data is displayed in the form of a graph with the highlighted event period (green or red color). The data is displayed either in one graph (daily raw data) or together with processed data (e.g., monthly sums).
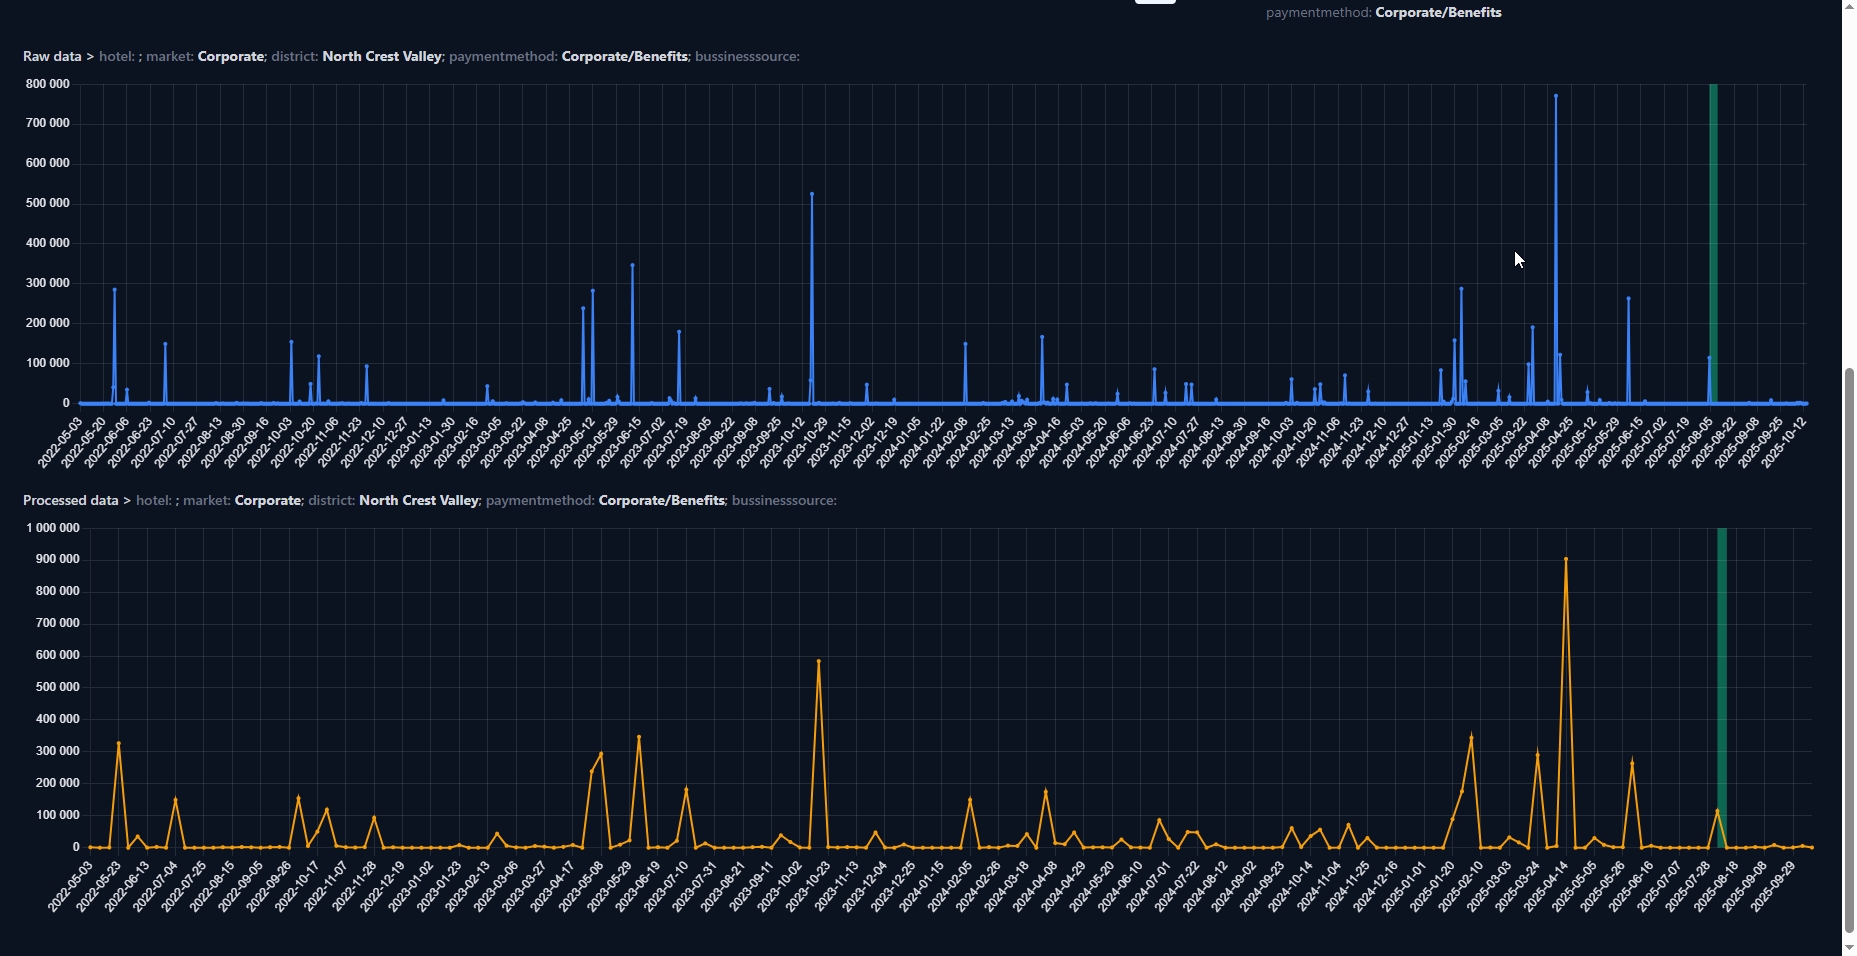
The display of anomalies and changes in the AnomalyGuard Dashboard application is effective and easily readable. Therefore, this application is also usable for non-technical users, for whom we can prepare filters over changes and anomalies in advance. They will then be able to read and use the results on a daily basis.
Another way to utilize AnomalyGuard results is to return them back to the environment where users already work today, whether it's corporate BI tools or core business applications (embedded analytics, augmented analytics). For these purposes, it is possible to use the built-in API interface, which is documented in a separate part of the documentation.